TransTab: Learning Transferable Tabular Transformers Across Tables
Author: Zifeng Wang (UIUC)
Tabular data (or tables) are the most widely used data format in machine learning (ML). However, ML models often assume a fixed table structure in training and testing. Before ML modeling, heavy data cleaning is required to merge disparate tables with different columns. This preprocessing often incurs significant data waste (e.g., losing unmatched columns and samples with missing ).
How to learn ML models from multiple tables with partially overlapping columns? How to incrementally update ML models as more columns become available over time? Can we leverage model pretraining on multiple distinct tables? How to train an ML model which can predict on an unseen table?
Summary: This blog highlights the TransTab method from our NeurIPS’22 paper to address these challenges of learning across multiple tabular datasets. Also check out our poster.
TransTab utilizes pretraining, transfer learning, and zero-shot learning on the tabular prediction task. The key idea of TransTab is to convert each sample (a row in the table) to a generalizable embedding vector, and then apply stacked transformers for feature encoding. Another methodology insight is to combine column description and table cells as the raw input to a gated transformer model. The other insight is to introduce supervised and self-supervised pretraining to improve model performance.
We compare TransTab with multiple baseline methods on diverse benchmark datasets and five oncology clinical trial datasets. Overall, TransTab ranks 1.00, 1.00, 1.78 out of 12 methods in supervised learning, feature incremental learning, and transfer learning scenarios, respectively.
Paper: TransTab: Learning Transferable Tabular Transformers Across Tables
Code: TransTab-github
Doc: Transtab-doc
Motivation
In this article, we refer to tabular learning as the predictive task of tabular data. For instance, many Kaggle competitions are based on tabular data, e.g., house price prediction, credit fault detection, CTR prediction, etc. This type of task is on predicting the target label through a couple of features, just like in the following table:
+-----------+------------+-----------+-----------+-------+
|   index   |  feature A | feature B | feature C | label |
+-----------+------------+-----------+-----------+-------+
|    0      |   x_1      |  x_2      |   x_3     | y     |
+-----------+------------+-----------+-----------+-------+
One might use linear regression to model y = a*x_1 + b*x_2 + c*x_3 +d. Compared with images and texts, tables are usually more frequently used in industrial applications. Recently there emerged the pretrain+finetune paradigm in the deep learning area, especially flourishing in computer vision (CV) and natural language processing (NLP).

Figure 1: CV or NLP models naturally assume the same basic input unit, i.e., pixel for images and word/token for texts. However, tabular models only accept a fixed-structure table: the train and test tables should *always* have equal column sets, which prevents us from transfer learning or zero-shot learning on tabular data.
In CV & NLP, pretrained models like BERT, and ViT have become the strong baseline for almost all tasks. By contrast, in the tabular learning domain, we usually encounter the case “XGboost is all you need.” In general, Gradient-boosting decision tree (GBDT) models can achieve competent performances with less effort on data preprocessing and hyperparameter tuning than deep learning-based methods. In this circumstance, many researchers have started to think about how we outperform GBDT using deep learning on tabular data.
Of course, there have been some efforts on transfer learning for deep learning-based tabular learning. For example, VIME [1], SCARF [2], and SubTab [3] all employ self-supervision for tabular learning. The common self-supervision can be categorized as generative and discriminative learning. For generative learning approaches [1], we mask several cells in the table and ask the model to recover the missing values; for discriminative learning approaches, we create positive samples by deleting or replacing cells and ask the model to discriminate between positive and negative samples [2].
Nonetheless, they hardly apply to real application cases, as they all require fixed-structure tables. We do not have a large table without labels, instead, we often have multiple heterogenous labeled tables. The core challenge is how to leverage as much labeled data as possible and get rid of heavy data preprocessing and missing value imputation.
The nature of only receiving fixed-structure tables causes all existing tabular methods to be incapable of dealing with pretraining on different tables. Even a minor change in the table’s structure occurs, e.g., a column named age changed to age in years, the pretrained model becomes useless. And we need to roll back to the pipeline of data processing, feature engineering, and then model training, which is costly in terms of time and money.
Therefore, we wonder if it is possible to propose a tabular model that encodes arbitrary input tables needless of any adaptions.
Flexible tabular learning
If we inspect any tabular data, we often identify the column names containing rich semantics or meta-data (e.g., data dictionary), which was often neglected by previous methods. We argue that interpreting features considering column names is necessary. For example, we know 25 under the column age means 25 years old instead of 25 km or 25 kg. We also know 0 under the column is_citizen means the person is not a citizen instead of is not anything else. Previous methods often ignore column names and enforce the model to learn semantics from the raw features for decision-making, which is often not transferable across tables.
In this work, we consider why not explicitly model the column names directly. Surprisingly, we do not find any prior arts doing this in tabular learning.
In this case, we model three common types of features: categorical, numerical, and binary. Formally, we process three types of features through
- For categorical: we concatenate column names and column values, i.e., the resulting concatenation can be “gender is male”.
- For numerical, we tokenize and embed column names, then multiply the column embeddings with the column value.
- For binary: we tokenize and embed column names, and decide if pass this embedding to the encoder if the column value is 1. That means, if the value is 0, this column is not encoded and included in the following prediction process.
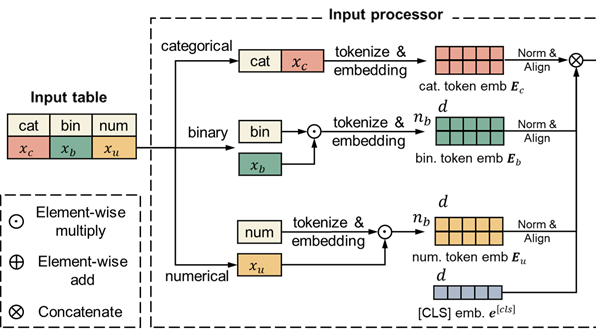
Figure 2: The input feature processing module of TransTab.
With this processing module, we can linearize, tokenize, and embed any tabular data for downstream applications.
Thanks to its flexibility, TransTab can learn across multiple heterogeneous tables. However, it is still nontrivial to design an effective pretraining algorithm across tables.
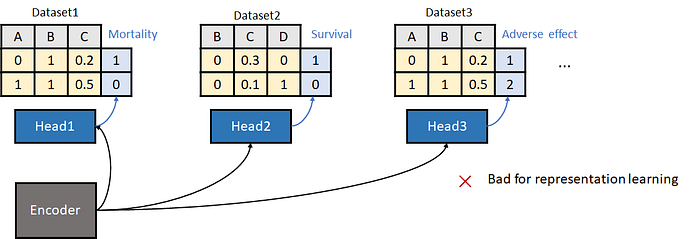
Figure 3: Learning across tables using naive supervised learning is harmful to representation learning.
The most straightforward way is illustrated in Figure 3: We train a shared backbone encoder plus task-specific classifiers across tabular datasets. We soon find this approach is suboptimal. The flaw comes from the heterogeneity of the target labels: two datasets might have an opposite definition of labels, which can confuse the pretraining model.
To address this issue, we propose a novel supervised contrastive learning approach, namely vertical partition contrastive learning (VPCL) in this paper.
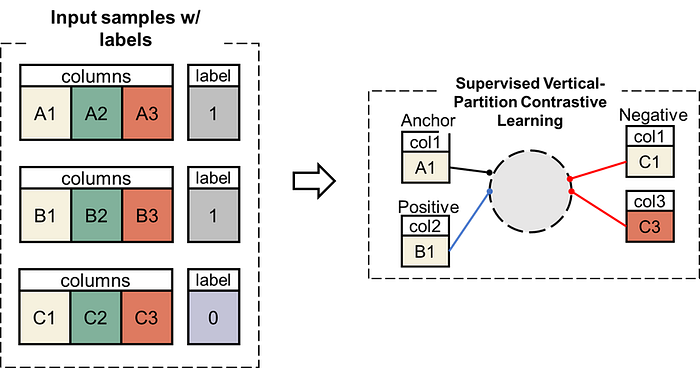
Figure 4: The proposed vertical partition contrastive learning (VPCL) approach for pretraining TransTab in our paper.
Its principle is:
- We split each raw (sample) into several partitions verti; each partition is a sample for contrastive learning.
- The partitions come from the same-label raw are positive, and otherwise negative.
VPCL has the following merits:
- It significantly expands the number of pairs for contrastive learning.
- It is much more efficient and robust because it does not add additional task-specific classifiers.
Thanks to its flexibility, TransTab now handles many new tasks.

Figure 5: The new tasks that are amenable to TransTab. Task (1): Learning across multiple labeled datasets (share the same label) based on supervised learning, and finetuned on each specific dataset; Task (2): Learning from an incremental set of features and data, which usually originates from the updated columns over time; Task (3): Pretrained on multiple labeled/unlabeled datasets (can have distinct labels) based on supervised VPCL, and finetuned on each dataset. Task (4): Learning from multiple labeled datasets (share the same label) based on supervised learning, and making predictions for brand new data without any further parameter updates.
For the complete experiment results, please refer to our paper. Here we present two key findings.
Pretraining
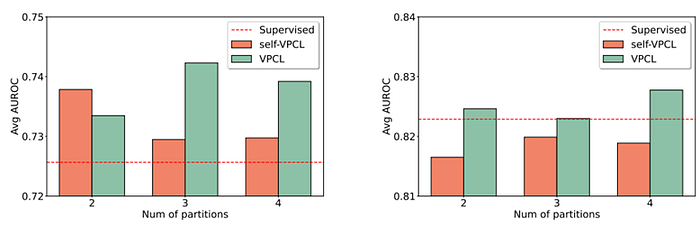
Figure 6: Experiment results of the pretraining+finetuning performances of TransTab.
Figure 6 illustrates the average performance (AUC) on multiple datasets. Left: on clinical trial patient outcome prediction datasets. Right: on many open datasets. The red dashline indicates the naive supervised learning performance. The X-axis is the number of partitions made for VPCL.
We find:
- Supervised VPCL generally improves predictive performances.
- There is no universally optimal number of partitions for VPCL.
- Compared with open datasets, the pretraining on similar tables (left Figure 6 uses only clinical trial tables) introduces much more improvements. That implies crucial to transfer knowledge from datasets coming from a similar domain. And the open datasets are very heterogeneous, and may not lead to any performance improvement.
Zero-shot learning (ZSL)

Figure 7: Experiment results of the zero-shot learning performances of TransTab.
Figure 7 demonstrate the zero-shot prediction performances of TransTab. We split one dataset into two parts and vary the overlap ratio of their column sets: from 0% to 100%. We find:
- TransTab can even make reasonable predictions when there is no column overlapping between the train and test data.
- When the overlap ratio increases, we witness better performances.
Code example
We open-sourced our package on GitHub with the documentation. It can be downloaded through
pip install git+https://github.com/RyanWangZf/transtab.gitAnd it is easy to use in tabular prediction tasks on multiple distinct tables:
import transtab

# load multiple datasets by passing a list of data names
allset, trainset, valset, testset, cat_cols, num_cols, bin_cols \
    = transtab.load_data(['credit-g','credit-approval'])

# build transtab classifier model
model = transtab.build_classifier(cat_cols, num_cols, bin_cols)

# specify training arguments, take validation loss for early stopping
training_arguments = {
    'num_epoch':5,
    'eval_metric':'val_loss',
    'eval_less_is_better':True,
    'output_dir':'./checkpoint'
    }

# start training
transtab.train(model, trainset, valset[0], **training_arguments)
For pretraining based on VPCL, we have
import transtab

# load multiple datasets by passing a list of data names
allset, trainset, valset, testset, cat_cols, num_cols, bin_cols \
    = transtab.load_data(['credit-g','credit-approval'])

# build contrastive learner, set supervised=True for supervised VPCL
model, collate_fn = transtab.build_contrastive_learner(
    cat_cols, num_cols, bin_cols,
    supervised=True, # if take supervised CL
    num_partition=4, # num of column partitions for pos/neg sampling
    overlap_ratio=0.5, # specify the overlap ratio of column partitions during the CL
)

# start contrastive pretraining training
training_arguments = {
    'num_epoch':50,
    'batch_size':64,
    'lr':1e-4,
    'eval_metric':'val_loss',
    'eval_less_is_better':True,
    'output_dir':'./checkpoint' # save the pretrained model
    }

# pass the collate function to the train function
transtab.train(model, trainset, valset, collate_fn=collate_fn, **training_arguments)
And after the pretraining completes, we can build a new classifier based on the pretrained model:
# load the pretrained model and finetune on a target dataset
allset, trainset, valset, testset, cat_cols, num_cols, bin_cols \
    = transtab.load_data('credit-approval')

# build transtab classifier model, and load from the pretrained dir
model = transtab.build_classifier(checkpoint='./checkpoint')

# update model's categorical/numerical/binary column dict
model.update({'cat':cat_cols,'num':num_cols,'bin':bin_cols})
In summary, duplicating the success of deep learning in CV & NLP in the tabular learning domain still requires rethinking the basic elements. In CV, we have pixel; in NLP, we have token/word. This paper proposes TransTab, a simple yet effective algorithm to model tabular data. Our method explores using NLP techniques for enhancing tabular learning, with the flexibility to handle arbitrary input tables. We hope this lead to more attention in deep learning for tabular learning.
[1] Jinsung Yoon, Yao Zhang, James Jordon, and Mihaela van der Schaar. VIME: Extending the success of self-and semi-supervised learning to tabular domain. Advances in Neural Information Processing Systems, 33:11033–11043, 2020.
[2] Dara Bahri, Heinrich Jiang, Yi Tay, and Donald Metzler. SCARF: Self-supervised contrastive learning using random feature corruption. In International Conference on Learning Representations, 2022.
[3] Talip Ucar, Ehsan Hajiramezanali, and Lindsay Edwards. SubTab: Subsetting features of tabular data for self-supervised representation learning. Advances in Neural Information Processing Systems, 34, 2021.